Analysing your indoor air quality data across your Wattics dashboard
Yay! You have made it to the final stage of the WatticsAir training material. We are so proud of you.
In this section, we will look into two different ways you can analyse your WatticsAir data across the dashboard. Starting off with setting alerts through the Notifications Settings feature.
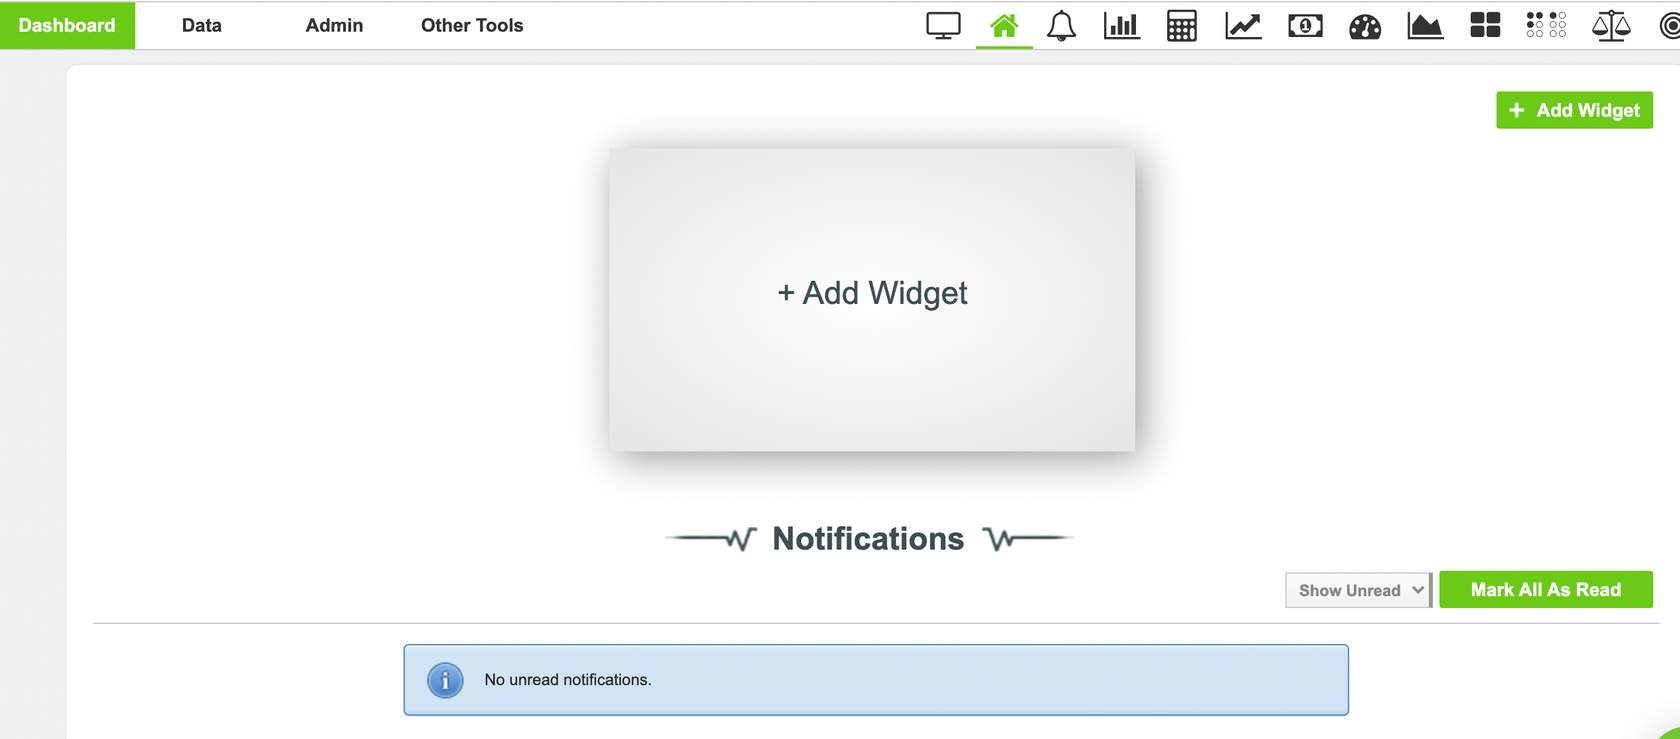
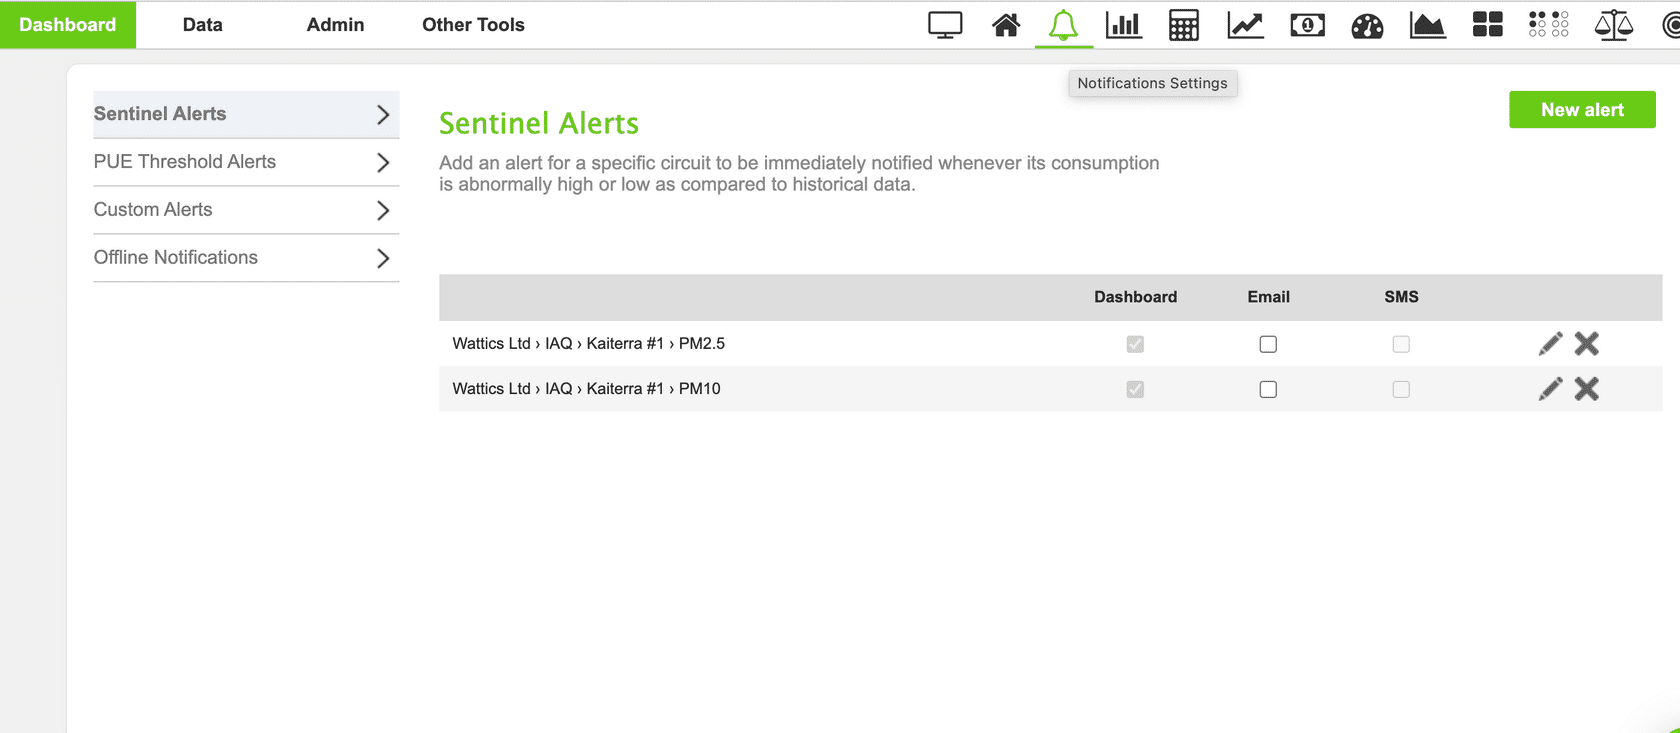
The Notifications Settings can be found through the bell icon on your dashboard. By clicking here (see screenshot below) you will be brought automatically to the sentinel alerts page.
Sentinel Alerts will predict the average levels retrieved from your IAQ meter and alert you with a notification if your IAQ falls outside of these average levels (shows to be abnormally high or low). These alerts can be set for the separate parameters (CO2, PM2.5) and are useful when attempting to monitor external factors that have an impact on your IAQ.
Custom Alerts is a tool available in the Notifications Settings. Custom Alerts allow you to set up thresholds to stay within acceptable levels of TVOC, PM2.5, PM10 etc . If any abnormalities are detected, you will receive a notification just like sentinel alerts. WatticsTip : This tool could be extremely useful in setting the thresholds for green building rating systems such as LEED, RESET or WELL.
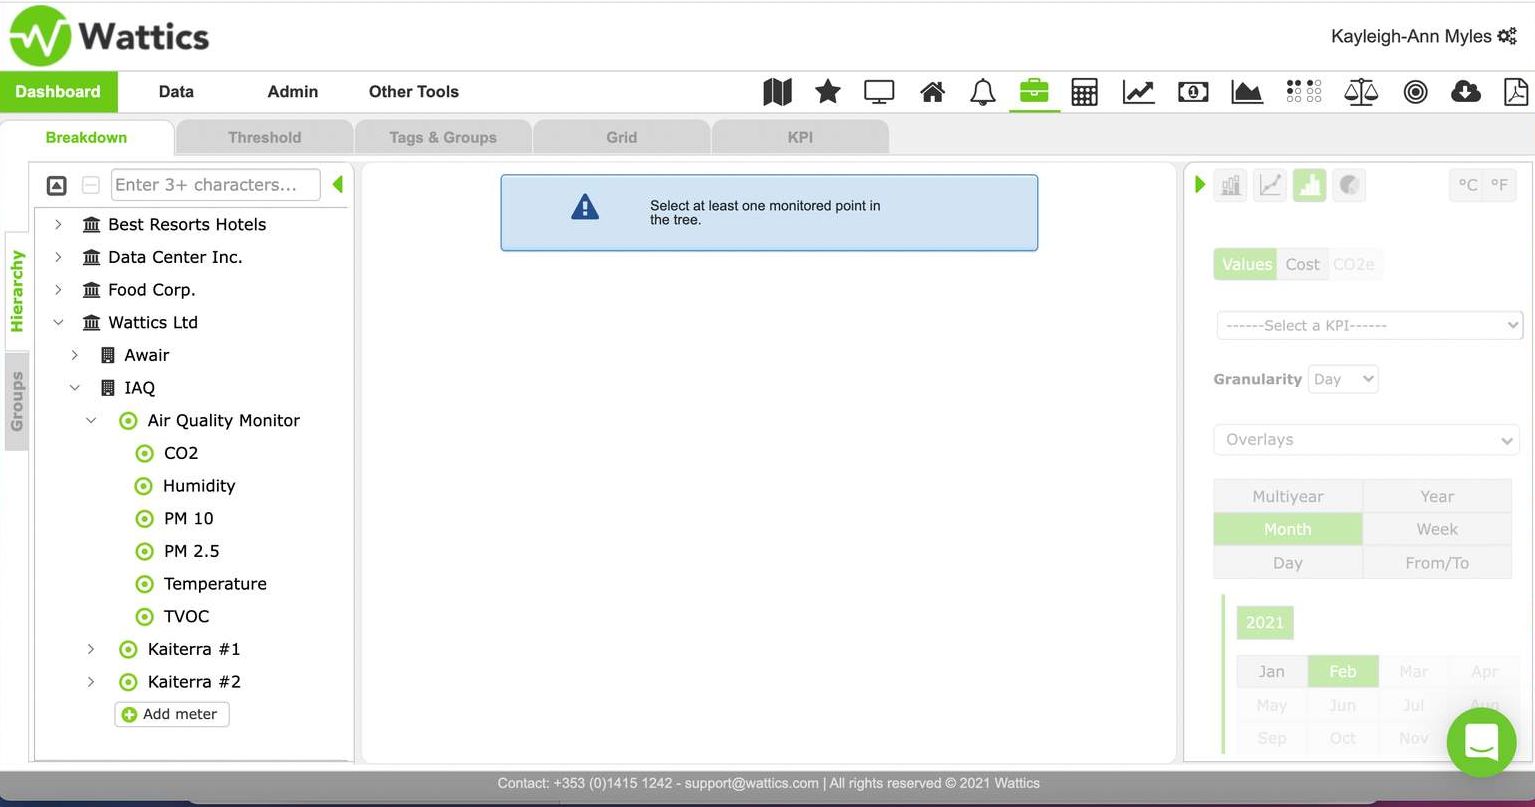
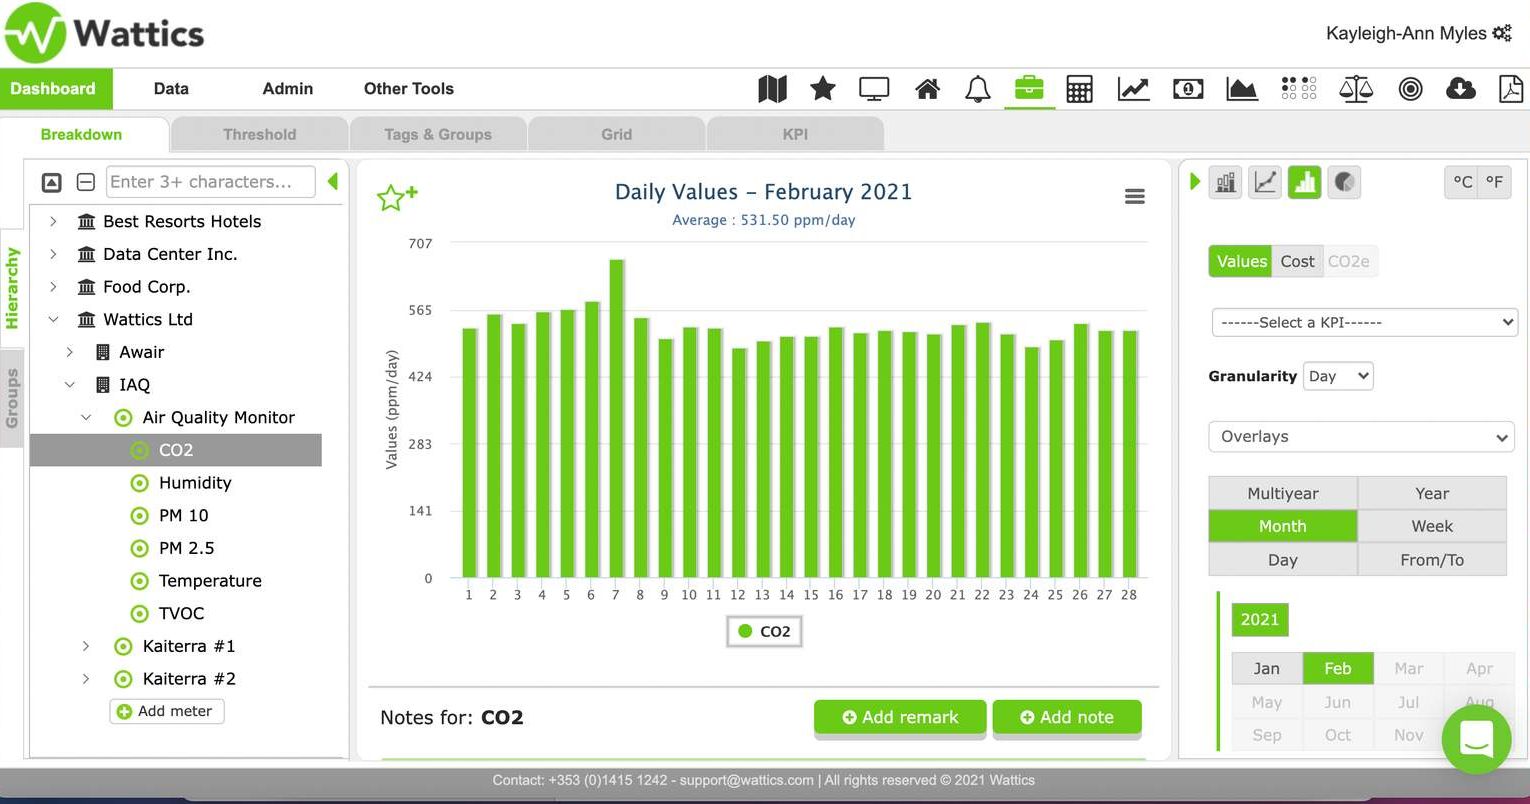
Another way you can optimize your WatticsAir data with your dashboard is through your Portfolio Analyst. The Portfolio Analyst feature builds on the functionalities of the Wattics Breakdown tool – developing your energy analytics capabilities. It provides you with an immediate overview of how your portfolio, or building/s, are performing with the ability to dive into your data to whatever extent is useful.
This feature is extremely useful when creating visualisations of the data being retrieved from your IAQ sensors or meters. With the Portfolio Analyst you will be able to set thresholds according to the desired levels you wish your parameters to be within. These thresholds are then locked to the particular parameter where you can then create visualisations of your data. These visualisations are also available in multiple graph forms.
Portfolio Analyst
Click through for a brief overview of the Portfolio Analyst feature and how you can visualize your WatticsAir data.
Firstly, navigate to the Portfolio Analyst tool (briefcase icon)
Step 1
Accessing the Portfolio Analyst
Visualizing your IAQ data within the Portfolio Analyst
There are many other analyses that can take form across your dashboard, however, as Helen Hayes once stated "The expert in anything was once a beginner". Plus, the Wattics team do not want to overwhelm you just yet.
We are so proud of you for getting this far and enabling yourself to become a master of managing your air quality and energy efficiency in the same place. If you wish to receive a certificate of attendance, just email our support team and we will issue it to you via mail.
Stay tuned for more content in taking WatticsAir training to the next step.